
I really love @Jivespins’s Visual Hexagon idea, and having seen someone else drawing on blank hexagons I thought about trying DIY visuals hexagons with classes.
Very simply, pupils design their own visual hexagons and then annotate/link to explain the topic or question. As seen below, these are examples that I trialled with bottom set year 8 today and they really enjoyed it and were able to explain multiple causes of the population growth.
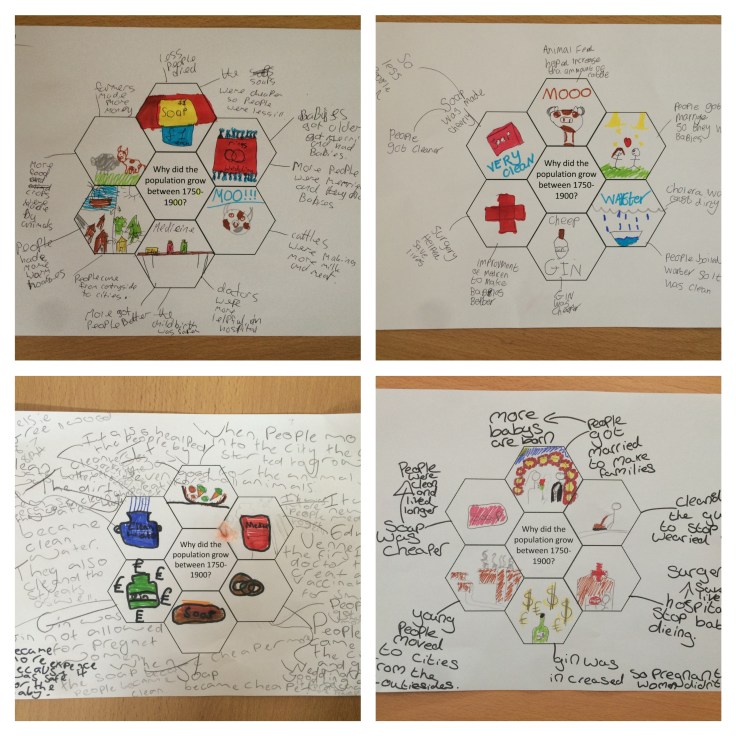
With two pupils for challenge, I got each pupils to first draw their pictures to represent the population growth in the IR, and then asked them to swap and use the pictures to explain their own understanding.
I will be doing again tomorrow with 8 set 2, and asking the to peer work and then draw links and explain in red pen to show the multi-causality.
Please find attached resource:

Leave a comment